Group: Krishna Sardana, Sanjot Singh, Saloni Shah, Sofia Fernandez Chacin, and Monica De Armas
Introduction
Pairs trading is an algorithmic trading strategy where trading occurs based on the idea that pairs of securities will always revert back to their historical spread. In order to make a profit, investors go long and short during the period when the spread between these two stocks diverges. When the spread returns to its historical mean, at least one of the positions will result in a profit. Trading on pairs of stocks in the same industry is the beneficial because they will react to similar market factors, therefore having similar price variations. Once investors identify a pair of stocks, they verify the prices of the stocks are cointegrated before trading them. Investors can trade using various statistical thresholds that will allow them to figure out if the current spread is near the historical mean spread or not.
Problem Statement
We aim to employ Machine Learning to find the ideal pair of stocks and predict their future spread which we can trade upon. Predictive models in the stock market are mainly used to learn about the upcoming fluctuation of different securities. Attaining an accurate projection leads to a potential increase in return for investors. Machine Learning is useful in this context because there’s a large range of methods that have the potential to discover patterns in datasets, leading to important resolutions.
Data Collection
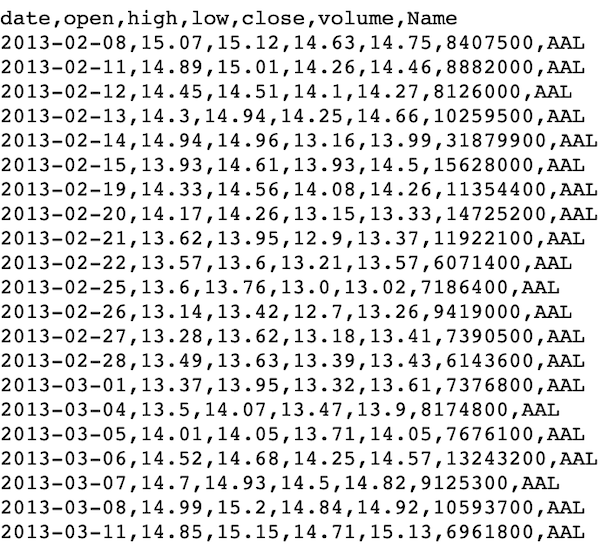
The dataset that we chose was the stock price data from the S&P 500 from 2013 to 2018. This includes the open and close prices of the day, the high and low prices of the day, and the volume traded. However, the column that we were interested in was the close prices as we decided they would be the best data to trade upon for the algorithm. We started by pre-processing the data by taking the raw dataset which had vertically stacked datapoints as shown:
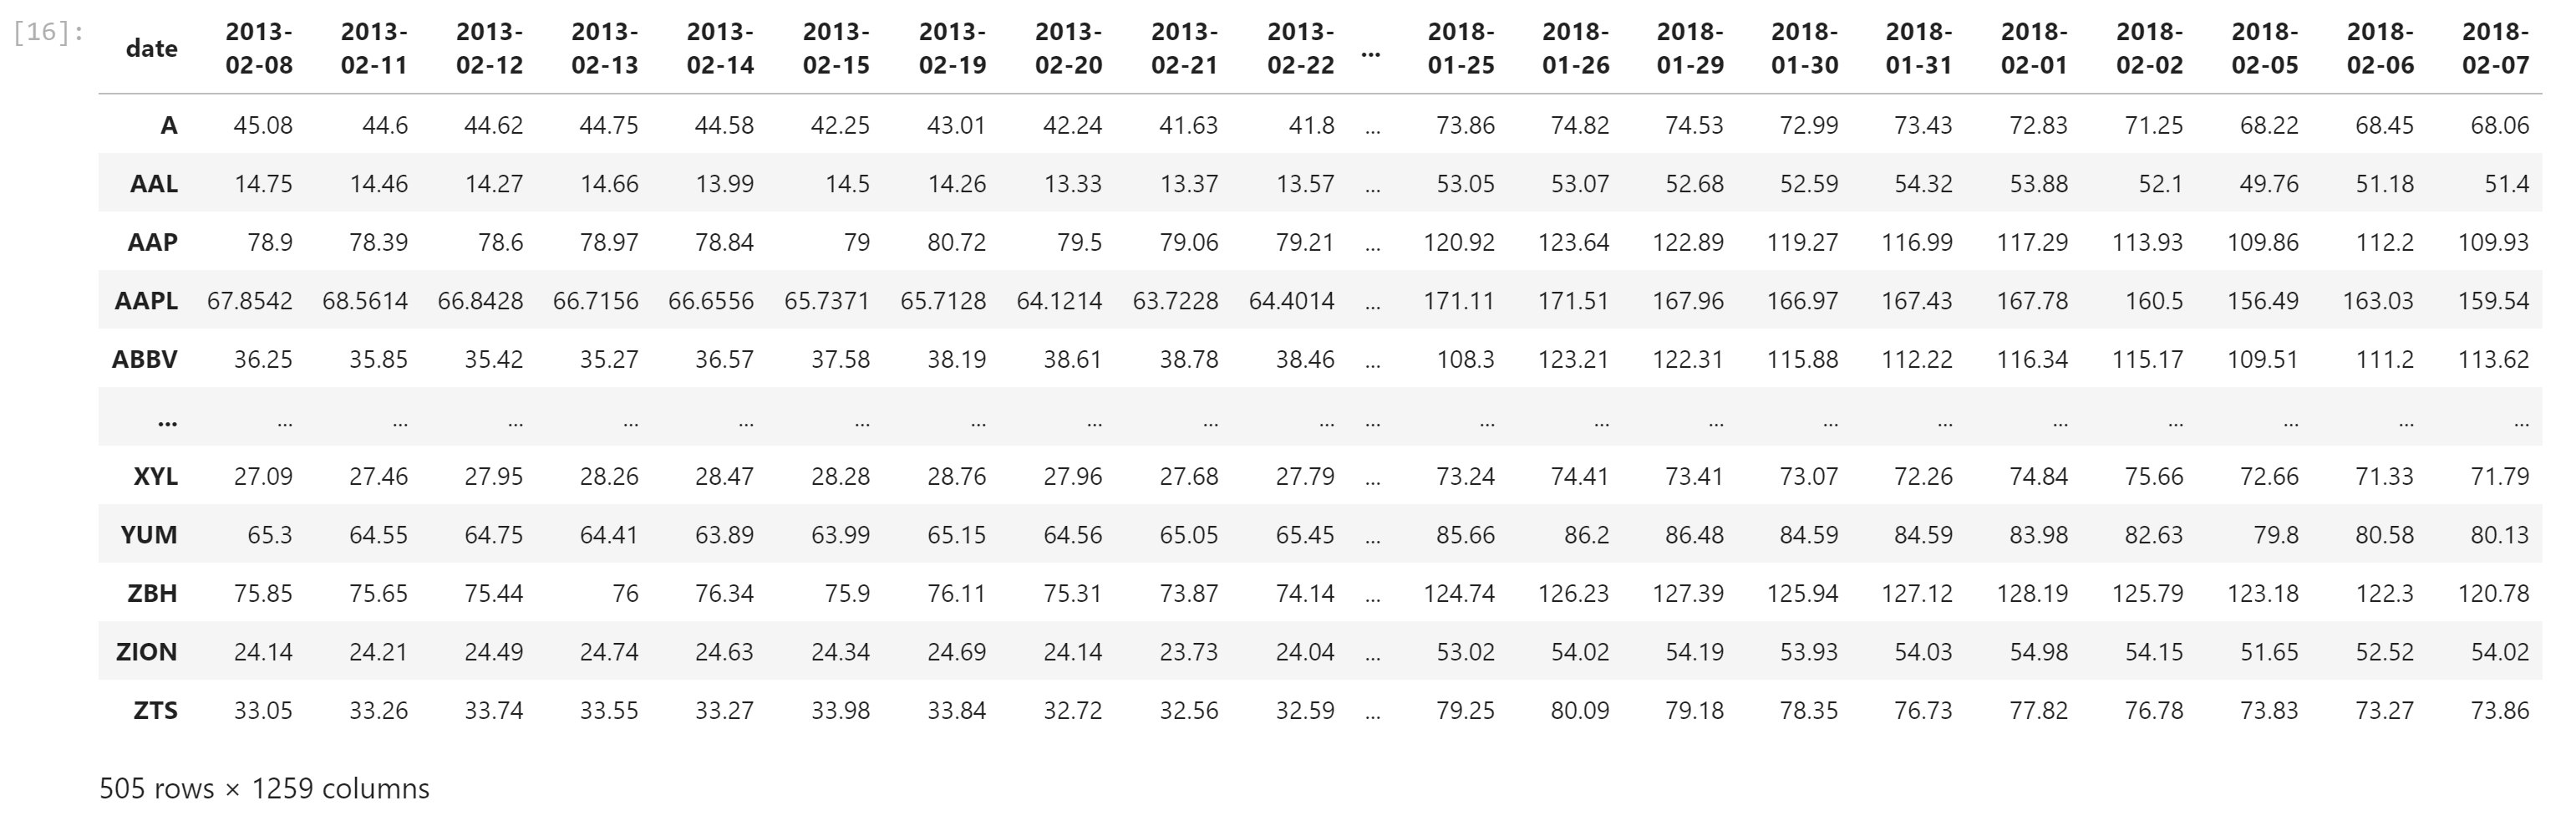
This was not the way we wanted the data to be formatted as we wanted to have each row show the close prices of different stocks over the five years. Therefore, we processed the data and were able to put each individual stock in time series order as shown:
Then, we found the daily percent change which is important as we are looking for pairs of stocks that have similar percent changes day over day which is what we pass into the PCA model.
Methods
Chronologically, our first ML method, PCA, lowered the dimensionality of the dataset by reducing the 1259 days of closing prices down to 300 principal components. Then, we used OPTICS, which is an unsupervised method similar to DBSCAN that will result in unique clusters of high density. We picked OPTICS over DBSCAN because it can handle clusters of varying density which is one of DBSCAN’s weaknesses. This method allowed us to take a large pool of stocks and cluster them based on their daily percent change. Then, we conducted the Augmented Dickey Fuller Test (ADF) to find the cointegration between each stock in a cluster which allowed us to determine ideal pairs within each cluster. Finally, we conducted both LASSO and Ridge regularized regression methods to predict the future spread between an ideal pair which can be used to determine the z-score to trade based upon. Utilizing the z-scores that we predicted, we backtested the pairs trading algorithm and tracked generated returns.
Process
Ideal results for the clustering will provide information regarding which correlated stocks are diverging in order to identify which stock should be opened on the long position and which should be opened on the short position. Our analysis is based on the assumption that the spread of a pair of correlated stocks will eventually converge. Therefore, by clustering based on percent changes and then looking for cointegration will guarantee convergence to the mean spread.
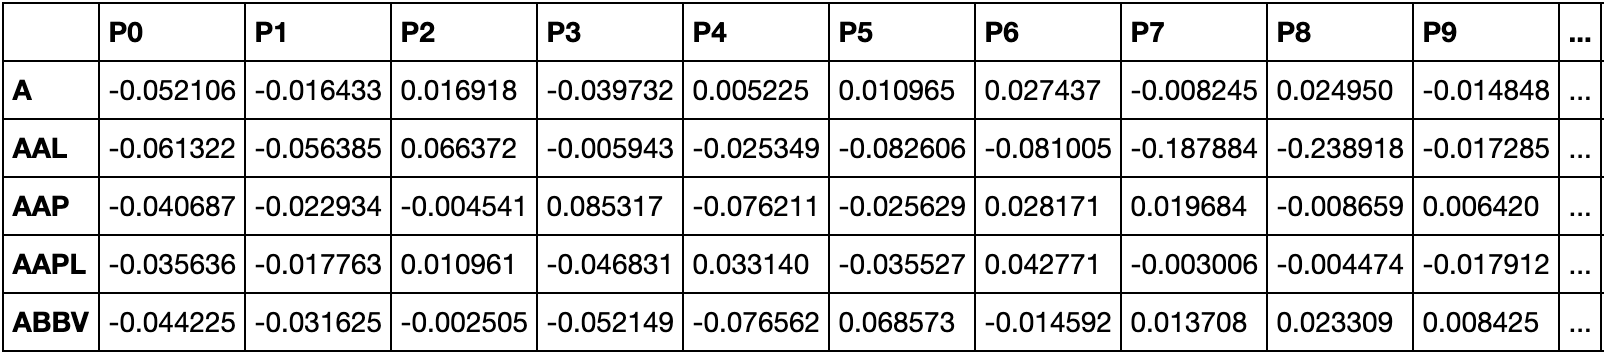
We applied PCA the dataset and lowered the 1259 days of closing prices for each stock down to 300 components. The results were as follows (example of first 9 components):
The next step was to cluster the stocks based on these 300 components for each stock. We applied OPTICS clustering on the PCA result and the clustering was as follows:
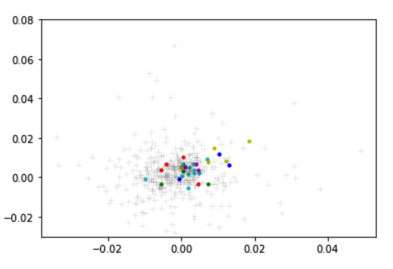
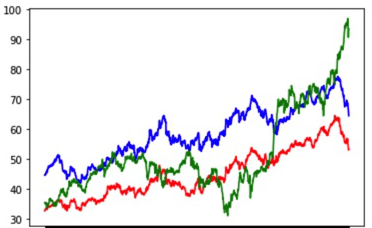
This is an example of 3 stocks in plotted from cluster 0:
Our next step will be to find cointegrated stocks within these clusterings using the Augmented Dickey-Fuller Test:
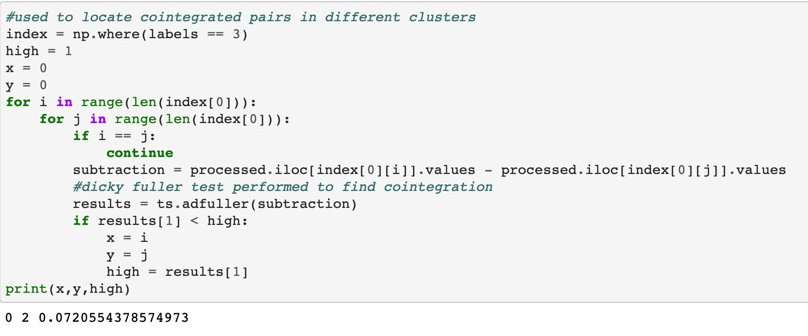
For each cluster, we run Dicky-Fuller Test on different pairs of stocks and look for the lowest p-value returned from the test. The two lowest p-value pairs were AIZ (Assurant) & ECL (Ecolab) and MPC (Marathon) & PRU (Prudential). We used these pairs in our linear regression.
We conducted our lasso linear regression on two pairs of correlated stocks. We split the data into training and testing by arbitrarily choosing 4/5 of the data for training and 1/5 for testing. We found the spread by calculating log(a) - lasso.predict(log(b)). We found the z-score by calculating (spread - mean(spread))/(standard deviation of spread). For our Lasso regression, we used the LassoCV function of the scikit-learn library because the function cross validates alpha using the K-fold method. Additionally, we chose the best degree by calculating the error associated with each degree and then training the data again with the degree that produced the least error.
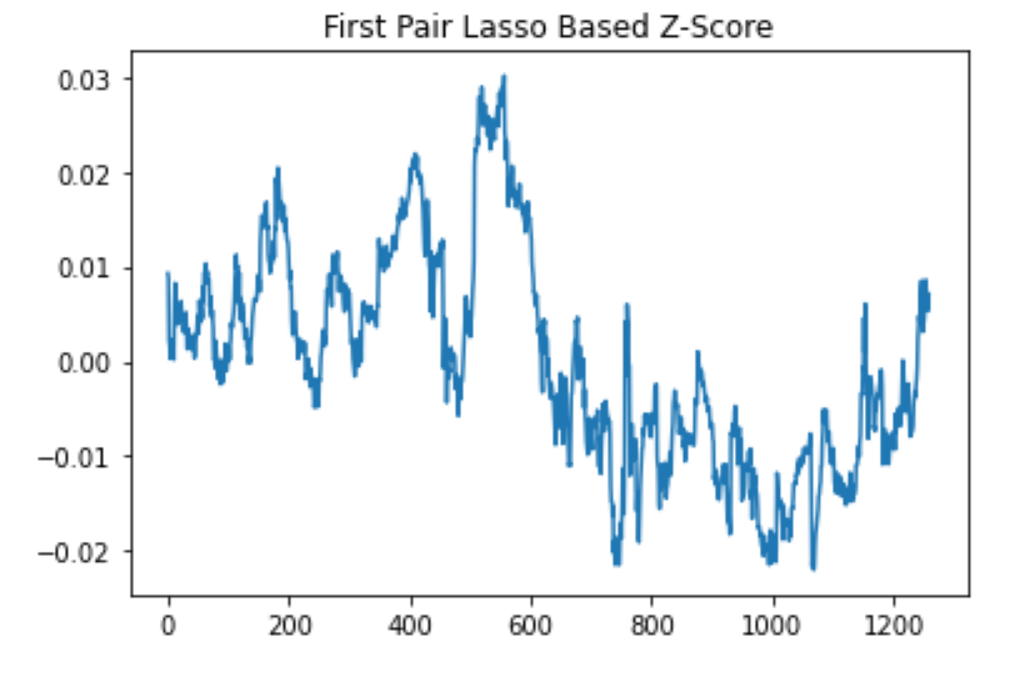
Lasso linear regression z-score results from the AIZ (Assurant) & ECL (Ecolab) pair of stocks.
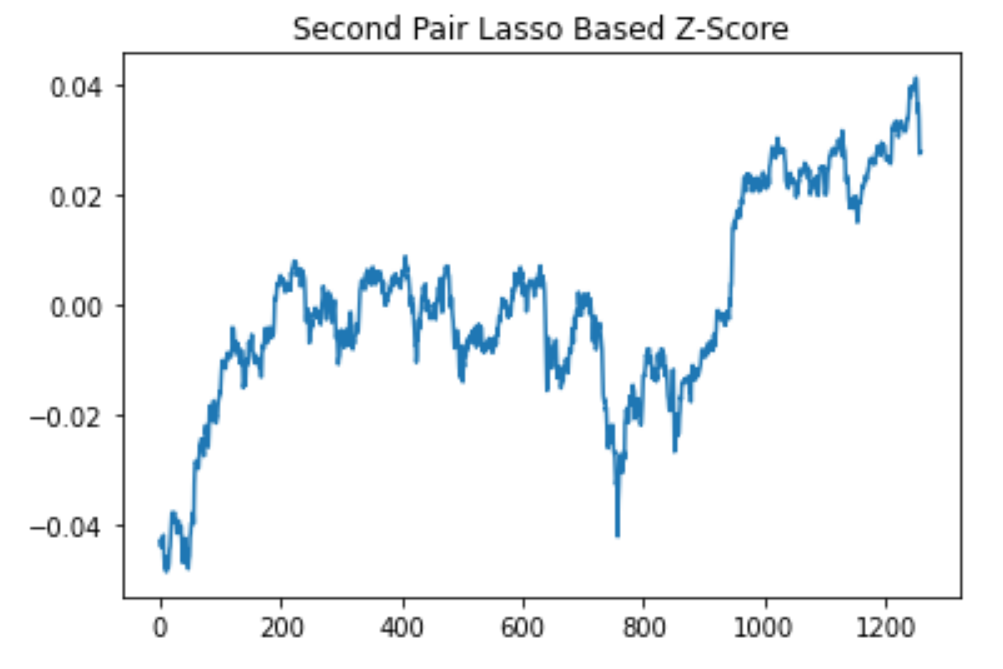
Lasso linear regression z-score results from the MPC (Marathon) & PRU (Prudential) pair of stocks.
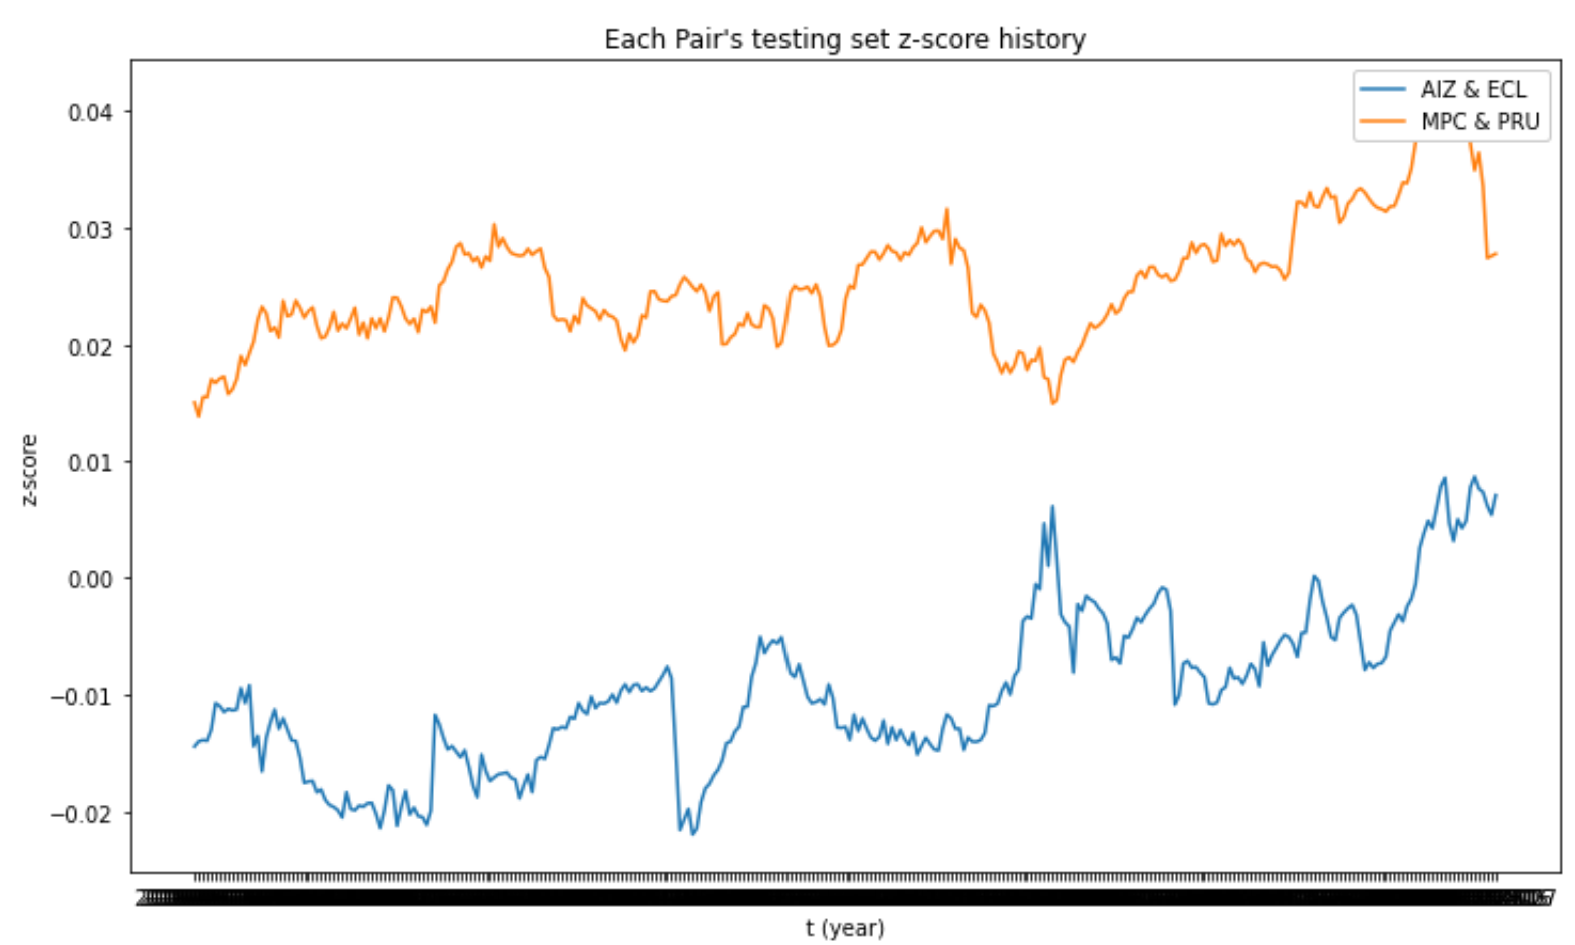
Each pair’s Testing Set Z-Score History for Lasso Regression
We conducted our ridge regression similarly to lasso regression. We also split the data into training and testing by arbitrarily choosing 4/5 of the data for training and 1/5 for testing. We found the spread by calculating log(a) - ridge.predict(log(b)). We found the z-score by calculating (spread - mean(spread))/(standard deviation of spread). We chose an alpha value of 1.0. We chose the best degree by calculating the error associated with each degree and then training the data again with the degree that produced the least error.
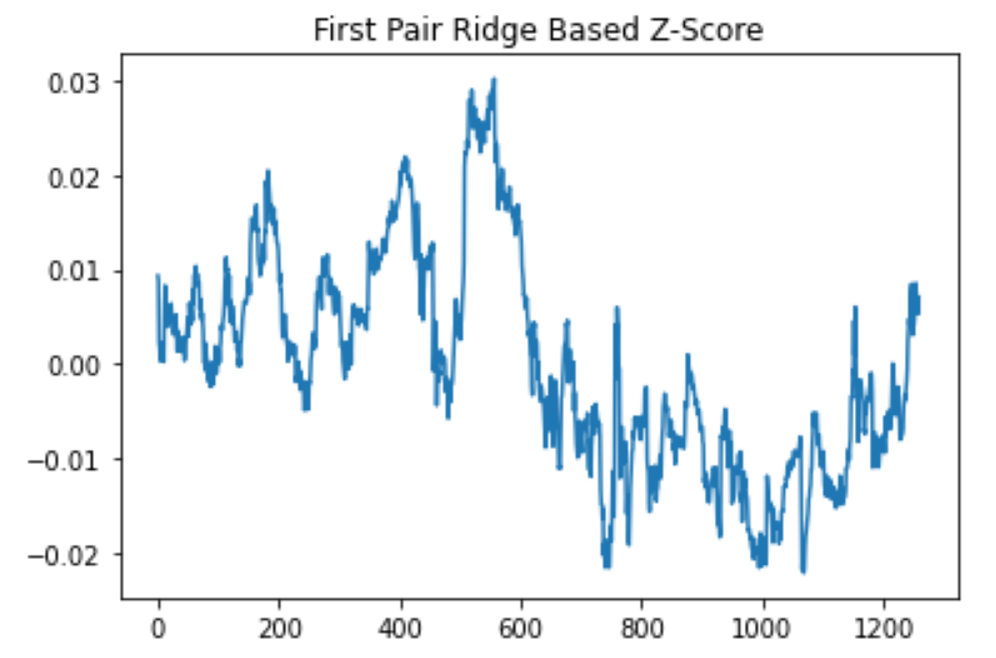
Ridge regression z-score results from the AIZ (Assurant) & ECL (Ecolab) pair of stocks.
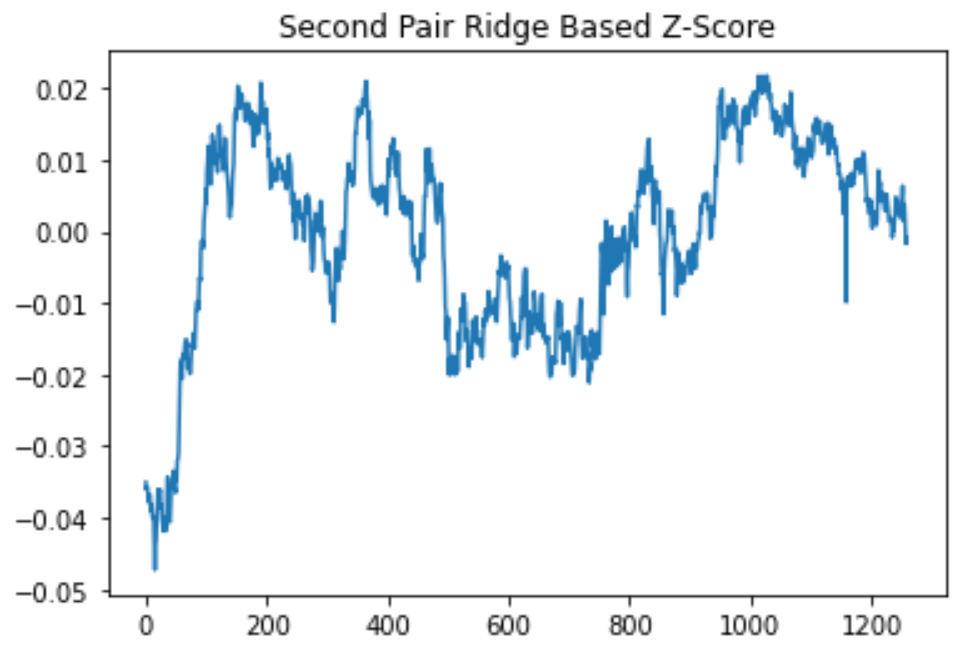
Ridge regression z-score results from the MPC (Marathon) & PRU (Prudential) pair of stocks.
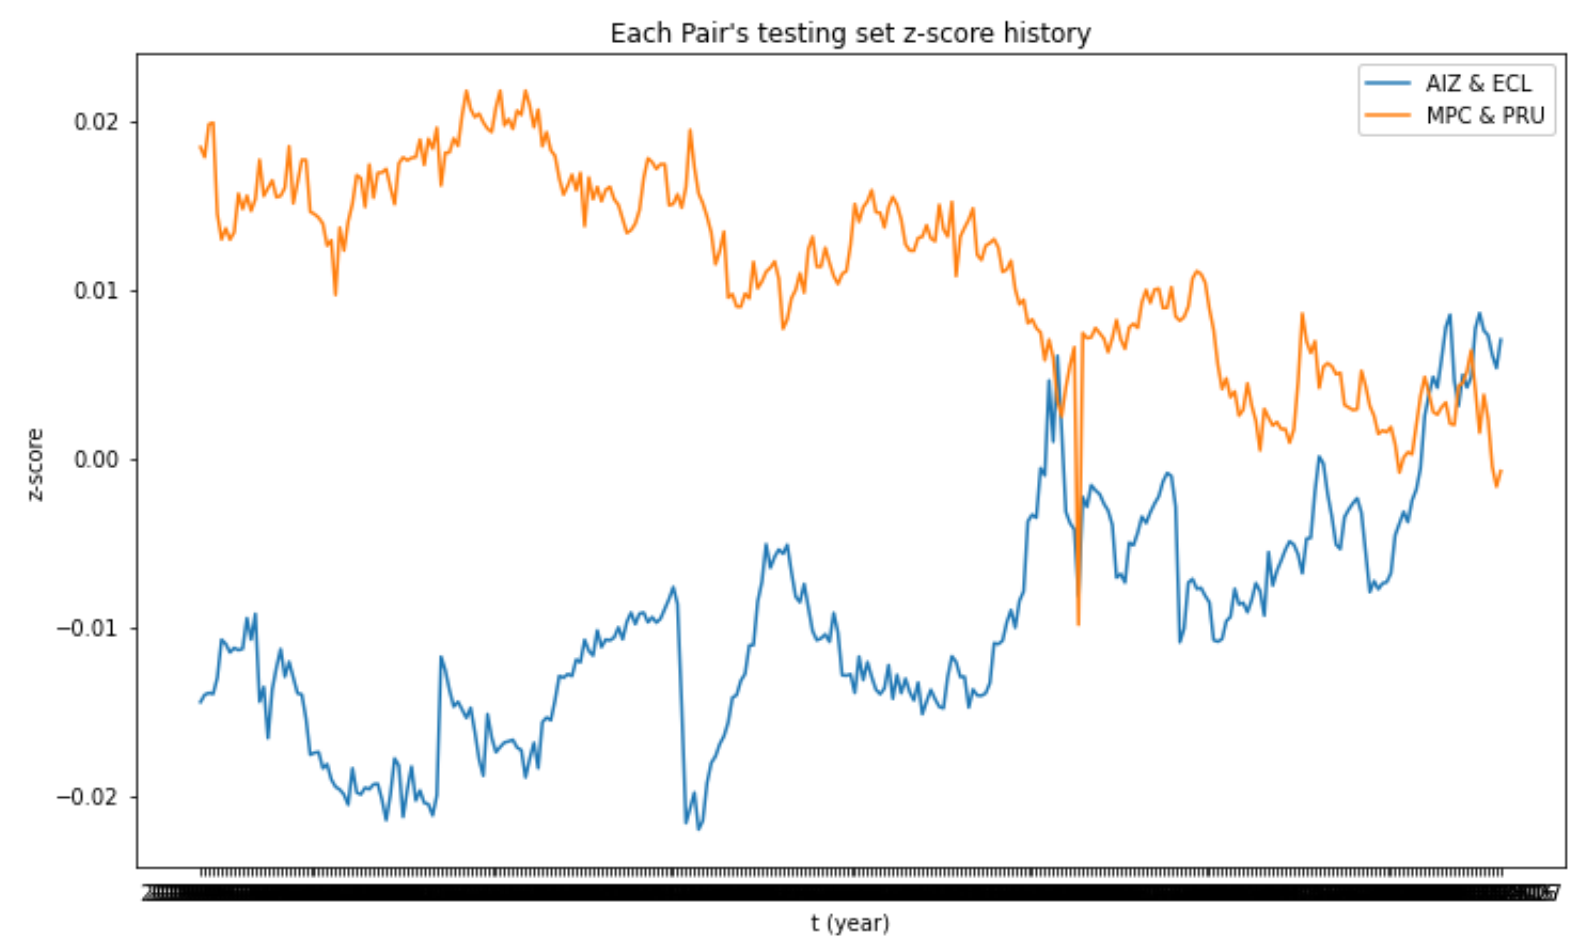
Each pair’s Testing Set Z-Score History for Ridge Regression
Results
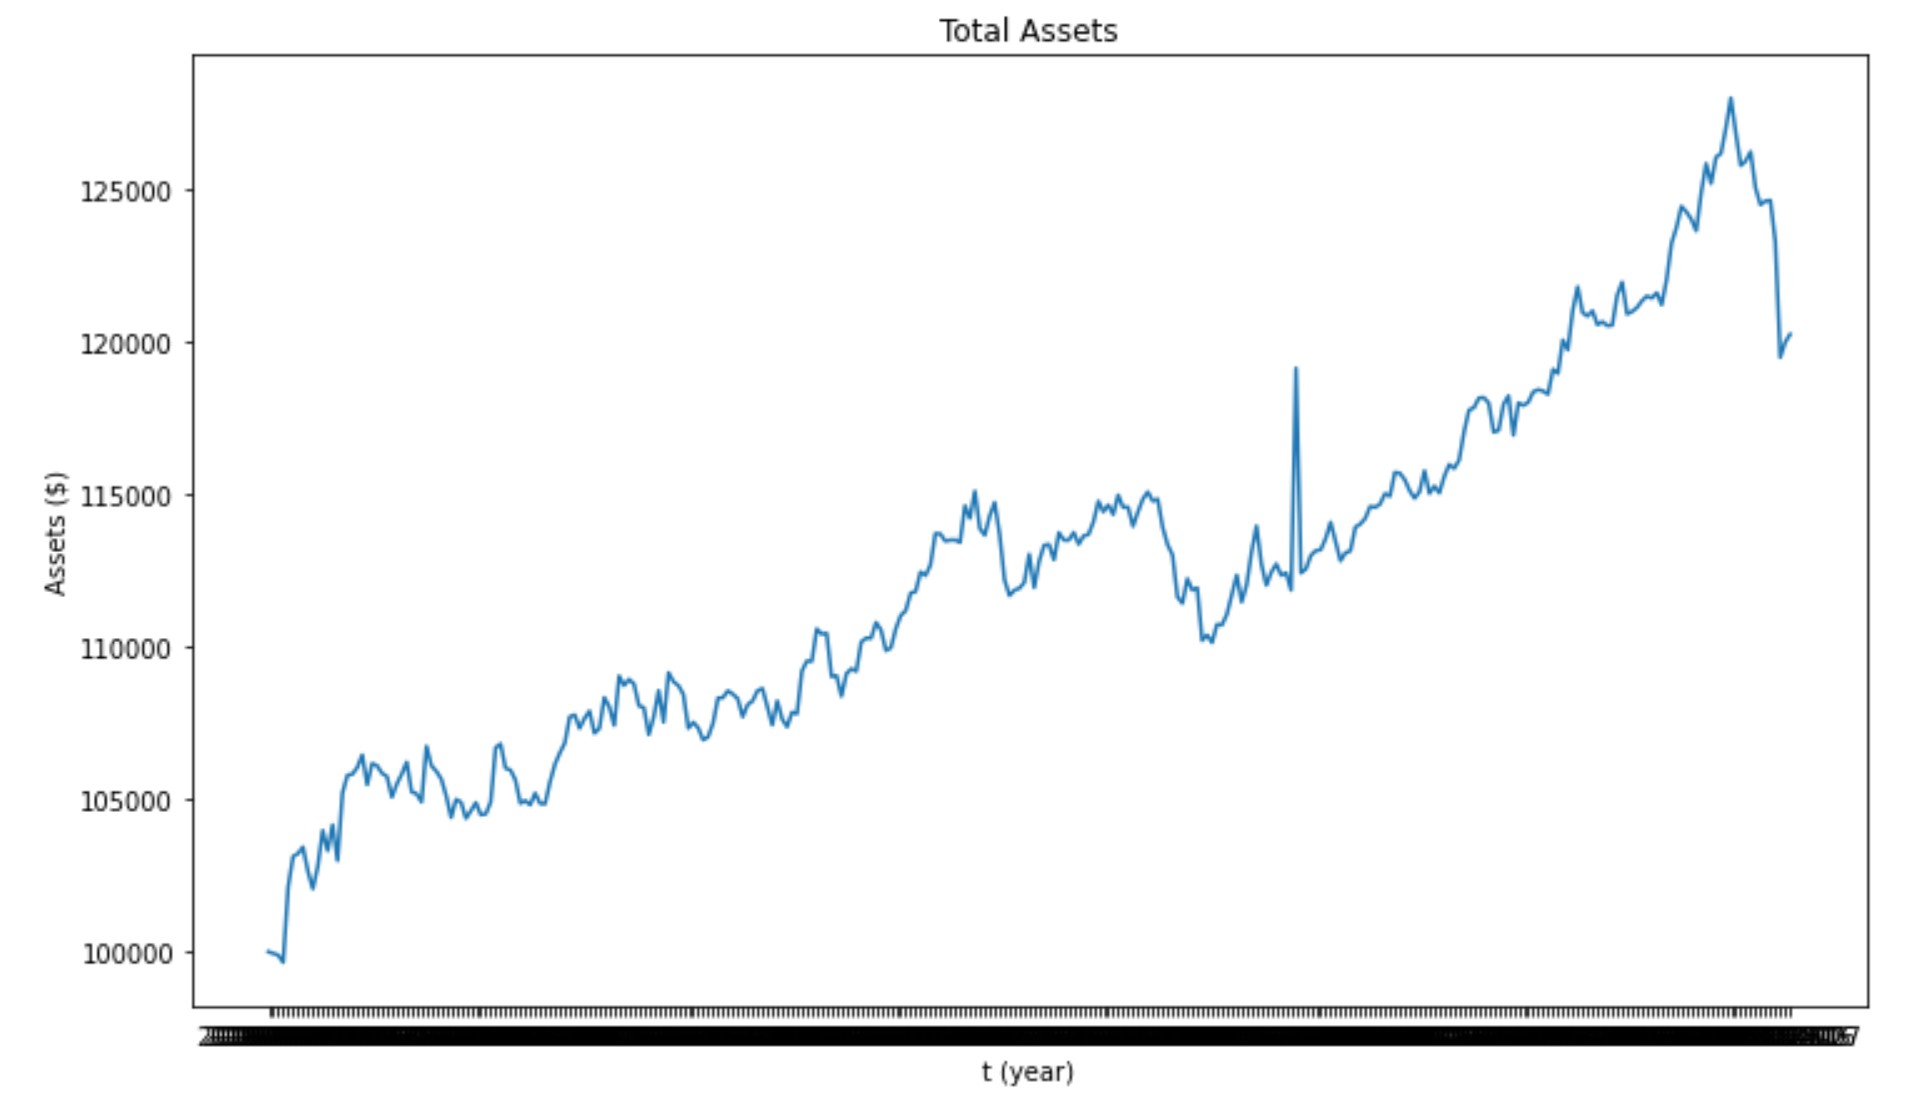
Total assets over time with Lasso regression. Total return: 20.2%
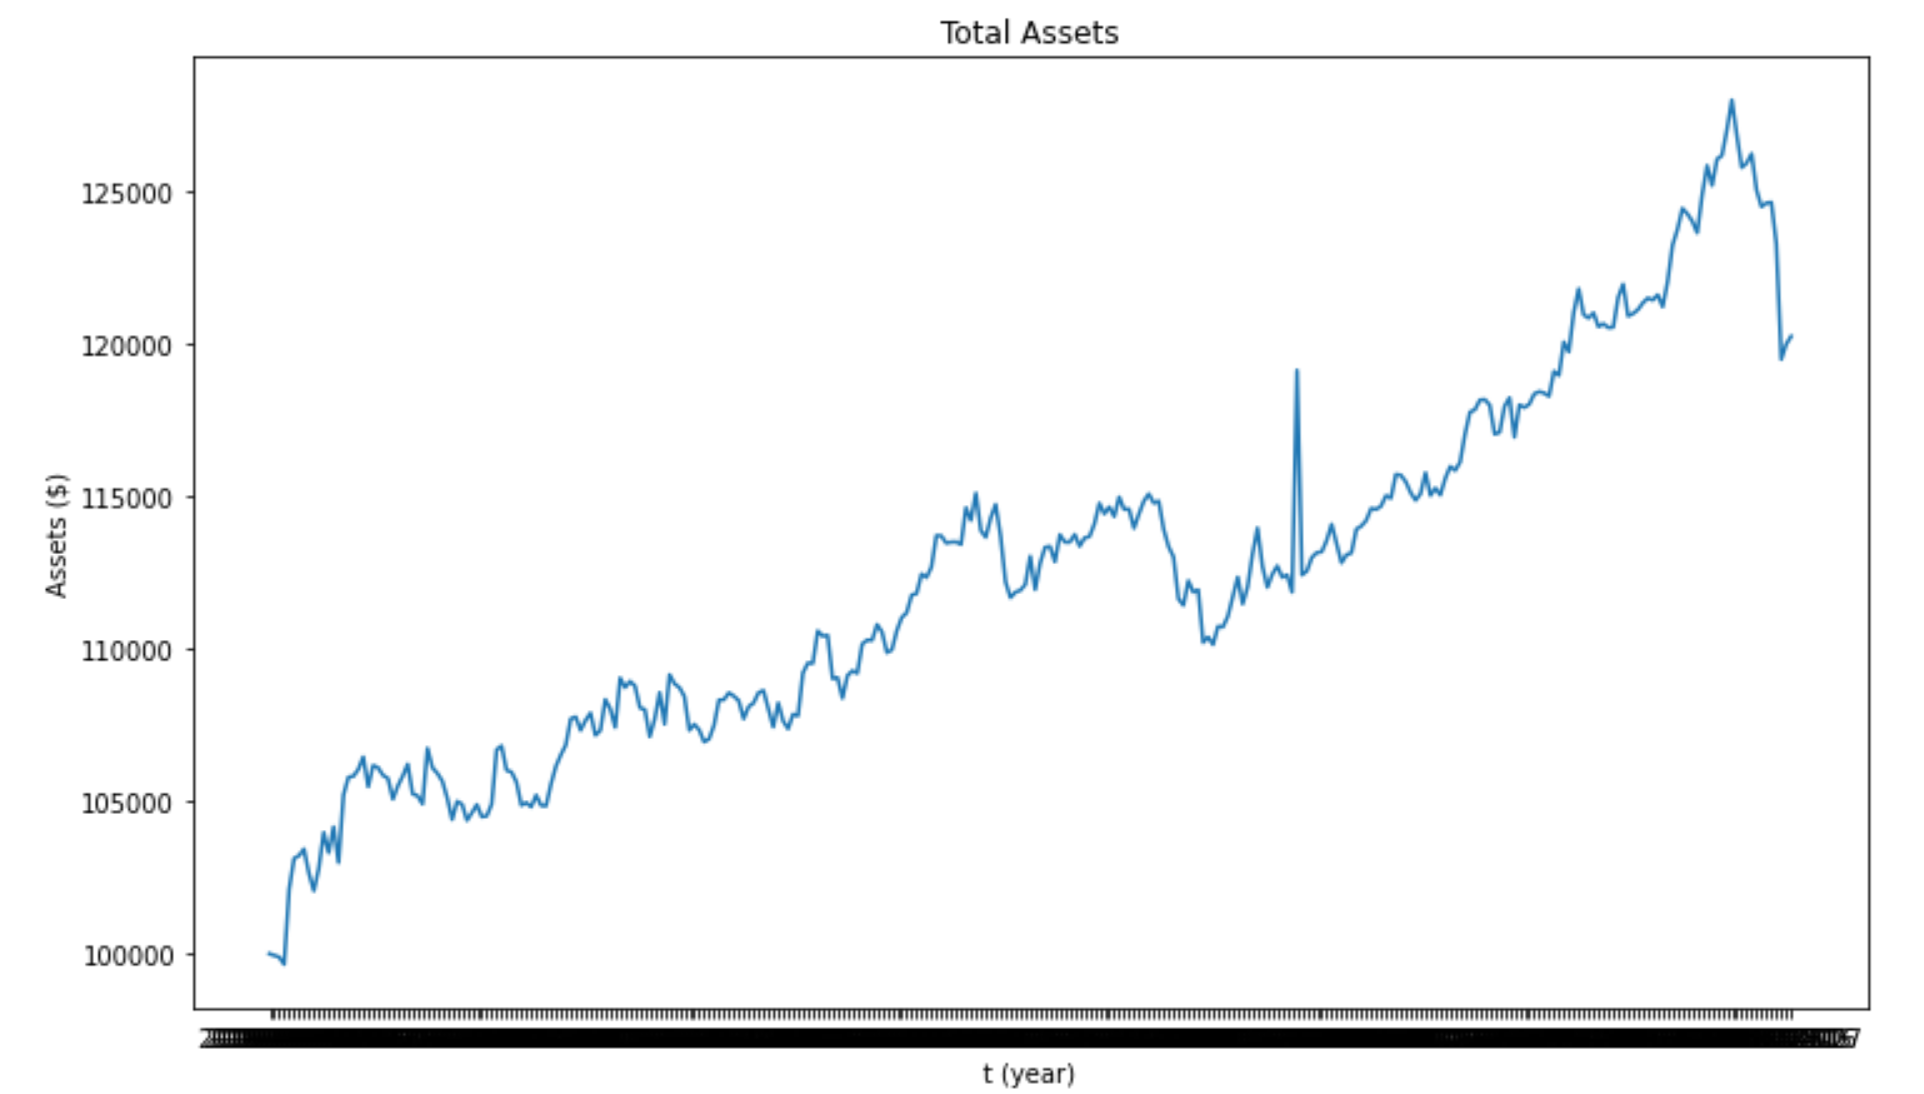
Total assets over time with Ridge regression. Total return: 20.2%
Discussion
Pairs trading is a quantitative trading strategy widely used by hedge funds and investment banks, since it offers a variety of market-neutral beneficial opportunities. To exploit them, it’s essential to work on identifying the best pair and on capturing their spread properly. ML methods have been utilized to optimize these 2 important steps, which is why individual investors no longer have to rely on the sole method of regression to aid in pair selection. Our proposed model makes an attempt to simulate mean-reverting stock pairs and differentiate them from those who have a correlation, but their spread is non-stationary. This means ML can help identify stocks that do not necessarily belong in the same industry but do have a correlation, increasing the possibility of making a profit.
Our project entails ML methods that develop an algorithmic pairs trading strategy. Utilizing such strategy creates larger risk-adjusted returns. By identifying a pair of stocks that historically move together, an investor can profit from deviations from the mean by taking a long-short position in the chosen pair. Our work may become interesting for trading firms, hedge funds and investment banks that intend to learn ways to potentially obtain more profit. The relevant methods in this work include the implementation of the OPTICS unsupervised clustering method to fulfill the search of profitable pairs, while constraining the search space, as well as PCA to reduce the number of features taken into account to avoid irrelevant ones and the known curse of dimensionality. We are contributing to the pairs trading field by combining it with ML implementation, since the union of the two fields is currently fairly unexplored and with plenty of room for discovery. Evolution on this matter is essential since it has proven its solid performance on unstable periods, like the global financial crisis.
Conclusion
After seeing the results of backtesting on both LASSO and Ridge regression, we can see that both strategies yield very similar results. While the z-score results for individual pairs were different, when we aggregate the results for all pairs of stocks the return for both models is 20.2%. In the future, our next steps to improve this model would include more extensive tuning of our hyperparameters to have a more accurate regression.
References
-
Sarmento, S., & Horta, N. (2020, May 04). Enhancing a pairs trading strategy with the application of machine learning. Retrieved March 03, 2021, from https://www.sciencedirect.com/science/article/pii/S0957417420303146
-
Vidyamurthy, G. (2011). Pairs Trading: Quantitative Methods and Analysis. Hoboken: John Wiley & Sons.
-
Chien-Feng Huang, Chi-Jen Hsu, Chi-Chung Chen, Bao Rong Chang, Chen-An Li, “An Intelligent Model for Pairs Trading Using Genetic Algorithms”, Computational Intelligence and Neuroscience, vol. 2015, Article ID 939606, 10 pages, 2015. https://doi.org/10.1155/2015/939606.
-
Nugent, C. (2018, February 10). S&P 500 stock data. Kaggle. https://www.kaggle.com/camnugent/sandp500.